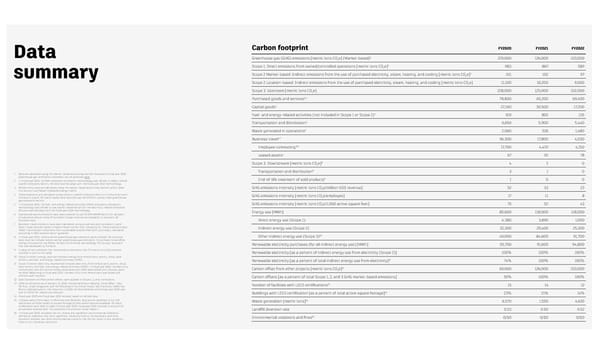
74 Data Carbon footprint FY2020 FY2021 FY2022 1 Greenhouse gas (GHG) emissions [metric tons CO e] (Market-based) 229,000 126,000 103,000 2 Scope 1: Direct emissions from owned/controlled operations [metric tons CO e]2 983 867 589 2 Scope 2 Market-based: Indirect emissions from the use of purchased electricity, steam, heating, and cooling [metric tons CO e]3 101 102 97 summary 2 Scope 2 Location-based: Indirect emissions from the use of purchased electricity, steam, heating, and cooling [metric tons CO e] 11,100 10,200 9,000 2 Scope 3: Upstream [metric tons CO e] 228,000 125,000 102,000 2 3,4 78,800 65,200 69,400 Purchased goods and services 4 27,100 30,500 17,200 Capital goods 5 Fuel- and energy-related activities (not included in Scope 1 or Scope 2) 919 802 135 4 Transportation and distribution 6,650 5,900 5,440 6 2,060 526 1,480 Waste generated in operations 4,7 96,300 17,800 4,030 Business travel 3,8 17,700 4,470 4,150 Employee commuting 4 67 92 78 Leased assets 9 Scope 3: Downstream [metric tons CO e] 4 2 0 2 9 3 1 0 1 Data are calculated using the market-based accounting method. Autodesk’s 昀椀scal year 2022 Transportation and distribution greenhouse gas veri昀椀cation statement can be accessed here. 9 1 0 0 2 In 昀椀scal year 2021, the 昀氀eet emissions estimation methodology was re昀椀ned to re昀氀ect vehicle End-of-life treatment of sold products speci昀椀c emissions factors. All data reported align with the 昀椀scal year 2021 methodology. 3 All electricity data are calculated using the market-based accounting method, which takes GHG emissions intensity [metric tons CO e/million US$ revenue] 52 33 23 into account purchased renewable energy credits. 2 4 These emissions are calculated using industry-speci昀椀c emissions factors in conjunction with GHG emissions intensity [metric tons CO e/employee] 17 11 8 Autodesk’s spend. All spend-based data reported use the US EPA’s supply chain greenhouse 2 gas emissions factors. GHG emissions intensity [metric tons CO e/1,000 active square feet] 75 52 43 5 In 昀椀scal year 2021, the fuel- and energy-related activities (FERA) emissions calculation 2 methodology was re昀椀ned to use market-based factors for the electricity-related emissions. All data reported align with the 昀椀scal year 2021 methodology. Energy use [MWh] 85,600 118,000 118,000 6 Operational waste emissions have been updated to use US EPA WARM factors for all years. Actual waste data at some of Autodesk’s larger sites are extrapolated to represent all Autodesk sites. Direct energy use (Scope 1) 4,380 3,890 1,050 7 Business travel emissions have been calculated using actual data and Autodesk's spend. All air travel data are based on 昀氀ights 昀氀own (rather than transactions). These emissions also Indirect energy use (Scope 2) 32,300 29,400 25,200 re昀氀ect the emission reductions from sustainable aviation fuel (SAF) purchases, calculated according to SBTi aviation sector guidance. 10 49,000 84,600 91,700 8 In 昀椀scal year 2021, remote worker greenhouse gas emissions were included. All commute Other indirect energy use (Scope 3) data reported include remote worker greenhouse gas emissions. To estimate home of昀椀ce energy consumption, we follow the Work from Home methodology “No Survey” approach Renewable electricity purchases (for all indirect energy use) [MWh] 55,700 91,600 94,800 that was developed by Anthesis. 9 A value of zero indicates that the emissions were less than 0.5 metric tons CO e and are rounded to zero in this table. 2 Renewable electricity [as a percent of indirect energy use from electricity (Scope 2)] 100% 100% 100% 10 Scope 3 indirect energy reported includes energy from remote work, events, cloud, data centers, and fuel- and energy-related activities (FERA). 11 74% 100% 100% 11 Scope 3 indirect electricity represented includes electricity from remote work, events, cloud, Renewable electricity [as a percent of total indirect energy use from electricity] data centers, and fuel- and energy-related activities (FERA). In 昀椀scal year 2022, the electricity 12 transmission and distribution losses associated with FERA were added and previous years Carbon offset from other projects [metric tons CO e] 69,000 126,000 103,000 restated. Beginning in 昀椀scal year 2021, the electricity from remote work was added and 2 previous year restated. Carbon offsets [as a percent of total Scope 1, 2, and 3 GHG market-based emissions] 30% 100% 100% 12 Gold Standard certi昀椀ed carbon offsets were applied to Scope 1, 2, and 3 emissions. 13 LEED certi昀椀cations as of January 31, 2022, include facilities in Beijing, China; Milan, Italy; 13 15 14 12 Tel Aviv, Israel; Singapore; and the following in the United States: San Francisco, California; Number of facilities with LEED certi昀椀cations Boston, Massachusetts. The reduction in LEED-certi昀椀ed facilities since 昀椀scal year 2020 was due to COVID-19–related site closures. 14 23% 21% 14% Buildings with LEED certi昀椀cation [as a percent of total active square footage] 14 Fiscal year 2020 and 昀椀scal year 2021 restated based on re昀椀ned data. 15 Includes waste from major conferences and facilities. Data are extrapolated to our full 15 6,570 1,550 4,620 real estate portfolio based on square footage of sites where data are available. All major Waste generation [metric tons] conferences were held virtually in 昀椀scal year 2022. Fiscal year 2021 restated to account for actual data received after the publication of previous Impact Report. Land昀椀ll diversion rate 0.53 0.50 0.52 16 In 昀椀scal year 2022, Autodesk did not receive any signi昀椀cant environmental violations— de昀椀ned as violations that incur signi昀椀cant monetary 昀椀nes or nonmonetary sanctions. 16 0/$0 0/$0 0/$0 Autodesk received two minor environmental citations that did not result in any monetary Environmental violations and 昀椀nes 昀椀nes or non-monetary sanctions.
 Autodesk Impact Report Page 73 Page 75