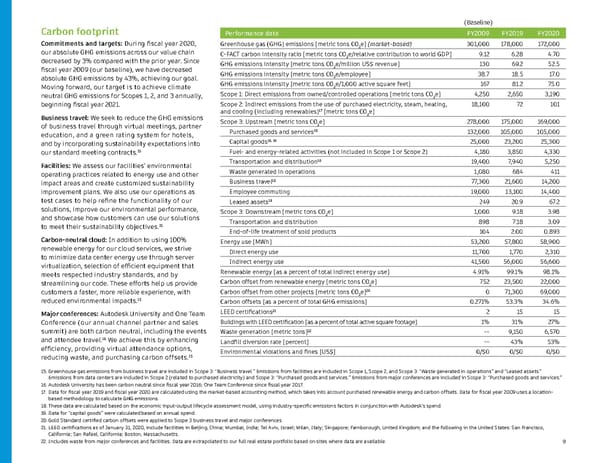
9 15. Greenhouse gas emissions from business travel are included in Scope 3: “Business travel.” Emissions from facilities are included in Scope 1, Scope 2, and Scope 3: “Waste generated in operations” and “Leased assets.” Emissions from data centers are included in Scope 2 (related to purchased electricity) and Scope 3: “Purchased goods and services.” Emissions from major conferences are included in Scope 3: “Purchased goods and services.” 16. Autodesk University has been carbon neutral since fiscal year 2016; One Team Conference since fiscal year 2017. 17. Data for fiscal year 2019 and fiscal year 2020 are calculated using the market-based accounting method, which takes into account purchased renewable energy and carbon offsets. Data for fiscal year 2009 uses a location- based methodology to calculate GHG emissions. 18. These data are calculated based on the economic input-output lifecycle assessment model, using industry-specific emissions factors in conjunction with Autodesk’s spend. 19. Data for “capital goods” were calculated based on annual spend. 20. Gold Standard certified carbon offsets were applied to Scope 3 business travel and major conferences. 21. LEED certifications as of January 31, 2020, include facilities in Beijing, China; Mumbai, India; Tel Aviv, Israel; Milan, Italy; Singapore; Farnborough, United Kingdom; and the following in the United States: San Francisco, California; San Rafael, California; Boston, Massachusetts. 22. Includes waste from major conferences and facilities. Data are extrapolated to our full real estate portfolio based on sites where data are available. Carbon footprint Commitments and targets: During fiscal year 2020, our absolute GHG emissions across our value chain decreased by 3% compared with the prior year. Since fiscal year 2009 (our baseline), we have decreased absolute GHG emissions by 43%, achieving our goal. Moving forward, our target is to achieve climate neutral GHG emissions for Scopes 1, 2, and 3 annually, beginning fiscal year 2021. Business travel: We seek to reduce the GHG emissions of business travel through virtual meetings, partner education, and a green rating system for hotels, and by incorporating sustainability expectations into our standard meeting contracts. 15 Facilities: We assess our facilities’ environmental operating practices related to energy use and other impact areas and create customized sustainability improvement plans. We also use our operations as test cases to help refine the functionality of our solutions, improve our environmental performance, and showcase how customers can use our solutions to meet their sustainability objectives. 15 Carbon-neutral cloud: In addition to using 100% renewable energy for our cloud services, we strive to minimize data center energy use through server virtualization, selection of efficient equipment that meets respected industry standards, and by streamlining our code. These efforts help us provide customers a faster, more reliable experience, with reduced environmental impacts. 15 Major conferences: Autodesk University and One Team Conference (our annual channel partner and sales summit) are both carbon neutral, including the events and attendee travel. 16 We achieve this by enhancing efficiency, providing virtual attendance options, reducing waste, and purchasing carbon offsets. 15 (Baseline) Performance data FY2009 FY2019 FY2020 Greenhouse gas (GHG) emissions [metric tons CO 2 e] (market-based) 301,000 178,000 172,000 C-FACT carbon intensity ratio [metric tons CO 2 e/relative contribution to world GDP] 9.12 6.28 4.70 GHG emissions intensity [metric tons CO 2 e/million US$ revenue] 130 69.2 52.5 GHG emissions intensity [metric tons CO 2 e/employee] 38.7 18.5 17.0 GHG emissions intensity [metric tons CO 2 e/1,000 active square feet] 167 81.2 75.0 Scope 1: Direct emissions from owned/controlled operations [metric tons CO 2 e] 4,250 2,650 3,190 Scope 2: Indirect emissions from the use of purchased electricity, steam, heating, and cooling (including renewables) 17 [metric tons CO 2 e] 18,100 72 101 Scope 3: Upstream [metric tons CO 2 e] 278,000 175,000 169,000 Purchased goods and services 18 132,000 105,000 105,000 Capital goods 18, 19 25,000 23,200 25,300 Fuel- and energy-related activities (not included in Scope 1 or Scope 2) 4,180 3,850 4,330 Transportation and distribution 18 19,400 7,940 5,250 Waste generated in operations 1,080 684 411 Business travel 18 77,300 21,600 14,200 Employee commuting 19,000 13,100 14,400 Leased assets 18 249 20.9 67.2 Scope 3: Downstream [metric tons CO 2 e] 1,000 9.18 3.98 Transportation and distribution 898 7.18 3.09 End-of-life treatment of sold products 104 2.00 0.893 Energy use [MWh] 53,200 57,800 58,900 Direct energy use 11,700 1,770 2,310 Indirect energy use 41,500 56,000 56,600 Renewable energy [as a percent of total indirect energy use] 4.91% 99.1% 98.1% Carbon offset from renewable energy [metric tons CO 2 e] 752 23,500 22,000 Carbon offset from other projects [metric tons CO 2 e] 20 0 71,300 69,000 Carbon offsets [as a percent of total GHG emissions] 0.271% 53.3% 34.6% LEED certifications 21 2 15 15 Buildings with LEED certification [as a percent of total active square footage] 1% 31% 27% Waste generation [metric tons] 22 -- 9,150 6,570 Landfill diversion rate [percent] -- 43% 53% Environmental violations and fines [US$] 0/$0 0/$0 0/$0
 Sustainability report | Autodesk Page 8 Page 10